Peak Oil and Climate Change notes

A summary review of recent reports and papers on Peak Oil and Climate change

Peak Oil: A lost decade

In just the last six months, a growing number of reports and academic papers have discussed the theory of Peak Oil, “the point where further expansion of oil production becomes impossible, because new flows are fully offset by production declines or depletion.” ((Heads in the Sand: Governments Ignore the Oil Supply Crunch and Threaten the Climate Global Witness, October 2009, p. 30)) Warnings of Peak Oil have become increasingly common over the last decade, but never more so than after the oil price spike in July 2008. Here, I review three recent publications, reflecting the views of an academic research group, a UK industry group and a UK-based NGO in order to provide a summary of the current, and what may be the final, oil crisis. ((Heads in the Sand: Governments Ignore the Oil Supply Crunch and Threaten the Climate Global Witness, October 2009; The Oil Crunch – A wake-up call for the UK economy The Industry Taskforce on Peak Oil and Energy Security (ITPOES) – February 2010; The status of conventional world oil reserves—Hype or cause for concern? Nick A. Owen n, Oliver R. Inderwildi, David A. King – March 2010))

Owen, Inderwildi and King’s recent paper, The status of conventional world oil reserves—Hype or cause for concern?, supports previous studies by others which show that conventional oil production peaked in 2005 and that the peak production capacity of all liquids (excluding gas), will peak around 2010. Conventional oil supply is declining by over 4%/annum, with the shortfall and anticipated additional demand being met by non-conventional oil (deep sea, tar sands) and other liquid sources such as gas and bio-fuels. In just ten years, 50% of the global demand for liquid fuel will have to be met by sources that are not in production today. Not surprisingly then, speculation over the price of oil based on fundamental supply and demand factors, as well as global events such as the invasion of Iraq, Hurricane Katrina and Israel threatening to attack Iran, has resulted in increased volatility of prices, reaching a high of $147 a barrel in July 2008. In 2000, a barrel of oil cost around $20. A decade later, the price of oil is around $80 a barrel and the trend remains upwards.

Different economic theories applied to the supply and demand of oil offer opposite outcomes. One suggests that the law of diminishing  returns would create an incentive to invest further in unconventional sources such as tar sands and deep sea resources. On the other hand, some economists argue that due to the inextricable link between oil and economic activity, high oil prices can’t be sustained and that a price of $100 a barrel would induce global recession, driving down oil prices and paradoxically reducing investment in alternative fuels. While rising oil prices can damage economic growth, lowering oil prices does not have the same, proportionate effect on stimulating growth. It has been estimated that oil price-GDP elasticity is -0.055 (+/- 0.005) meaning that a 10% rise in oil prices leads to a 0.55% loss in global GDP.

Owen, Inderwildi and King’s paper concludes that published world oil reserve estimates are inaccurate and should be revised downwards by a third. Over-reporting since the 1980s due to the ‘fight for quotas’ whereby OPEC agreed to set export quotas in proportion to reserve volumes, and the inclusion of tar-sands into reserve estimates since 2004 have distorted reality. They add that “supply and demand is likely to diverge between 2010 and 2015, unless demand falls in parallel with supply constrained induced recession” and that “the capacity to meet liquid fuel demand is contingent upon the rapid and immediate diversification of the liquid fuel mix, the transition to alternative energy carriers where appropriate, and demand side measures such as behavioural change and adaptation.”

In their report, The Oil Crunch. A wake-up call for the UK economy, the Industry Taskforce on Peak Oil and Energy Security (ITPOES) likens the effect of an imminent ‘oil crunch’ due mid-decade, with the current ‘credit crunch’.  The report identifies a slow down in the production of oil prior to 2013, when it then begins to drop and without replacement infrastructure already in place, little can be done to address this fully within the next five years. The authors note that the discovery rate of oil is inadequate to meet projected demand and they too, have concerns over published OPEC quotas.

It is worth noting the difference between conventional and unconventional oil, such as deep sea oil and tar sands. The ITPOES report note how the unconventional sources of oil are much more energy intensive to exploit and therefore more expensive to supply oil from. Whereas OPEC might extract a barrel of oil for around $20, deep sea oil might cost around $70 and a barrel of oil from tar sands costs around $90 to extract. Therefore, as conventional sources decline at more than 4% per year for conventional sources, the replacement non-conventional oil pushes the price upwards if demand is to be met.

Global oil demand is forecast to rise, although much of this increased demand will come from developing countries. An extrapolation of historical demand would suggest that 120Mb/day will be required by 2050, compared to our current use of around 84.5Mb/day. However, a historical extrapolation of largely OECD demand could be deceptive, given that five out of a global population of six billion people live in non-OECD countries like China and India, where demand for oil is growing strongest. OECD demand for oil has flattened out in recent years and may stay that way, yet globalisation has created new markets which are emerging in an environment of relatively high oil prices and may be more immune to price rises than OECD economies. Where OECD countries may tip into recession when oil hits $100/barrel, China’s economy and therefore demand for oil, may continue to grow.

However, it is one thing to extrapolate continued economic growth and a corresponding demand for oil and another to supply that demand. Like Owen, Inderwildi and King, the ITPOES report argues that global oil capacity will peak later this year at around 91-92Mb/d and continue at that level until 2015 at which time depletion will overtake capacity growth. Just as the production of conventional oil has plateaued since 2005, the production of all liquids will plateau from 2010/11 for about five years before entering terminal decline. This would have happened two years earlier were it not for the global recession temporarily reducing demand.

Similarly, the ITPOES report highlights the link between high oil prices and recessions, drawing on recent work that shows how every US recession since 1960 has been preceded by rapid oil price rises and that when the price of oil exceeds 4% of US GNP, a recession occurs shortly afterwards. Although this correlation is not necessarily causation, it is “highly suggestive” and the report notes that 4% at current GNP is around $80/barrel, roughly the price of oil at the time of writing. OPEC have publicly stated that they prefer a price around $75/barrel.

The relationship between oil prices and the economy is referred to repeatedly in the ITPOES report. OECD countries are heading some way towards a partial decoupling of economic growth from the consumption of oil, although not to an extent that assures overall energy security. By 2013, OECD and non-OECD countries are likely to each take half of the total global supply of oil. The recession since 2008 has had some impact on global oil consumption, but this is recovering quickly and demand is on the rise. By 2014, prices are expected to be volatile, between $120-$150/barrel resulting in “recessionary forces” which produce a repeat of the 2008 recession. Consequently, oil prices are then expected to drop to somewhere between $90-$120/barrel, picking up again as the global economy recovers. And so on…

For the UK, the ITPOES report highlights the vulnerability of the transport sector and the knock-on effects that higher petrol prices are likely to have on our ‘just-in-time’ business models, recalling the effects of the fuel protests in 2000. While the domestic, industrial and service sectors of the UK economy are able to reduce their reliance on oil products, the transport sector continues to use more, with road and air transport using more than 50% of total UK consumption in 2008.

Increases in the cost of oil are felt in other sectors due to the vulnerability of the transport sector. It raises the cost of capital and puts off investment. With transportation being integral to the supply chain, the price rise is felt through higher consumables, significantly, food. The agriculture sector is highly dependent on oil for transportation fuel and as a component in fertilisers and insecticides. Due to increasing overall energy prices, the number of households trapped in fuel poverty is expected to continue to rise. Their business-as-usual scenario is expected to see the UK become an overwhelmingly major energy importer, with a devalued currency that offsets economic growth.

A more explicitly critical report has been written by the NGO, Global Witness. Focusing on the ‘four fundamentals’ of oil field depletion, declining discovery rates, insufficient new projects and increasing demand, Heads in the Sand specifically targets governments and their agencies for inaction, being “asleep at the wheel” and demonstrating a lack of appreciation of the imminence and scale of the problem a global oil crunch will bring. The report is especially critical of the International Energy Agency (IEA), upon which governments rely for the reporting of data and forecasts.

Heads in the Sand highlights the geopolitical and social consequences of peak oil, linking the energy crisis to the climate crisis in terms of how short-term, national economic interests are overtaking the need to shift to more sustainable energy supply systems. The consequences of this are disastrous affecting almost every aspect of life, including “food security, increased geopolitical tension, increased corruption and threats to the nascent global governance reform agenda, and the potential for major international conflict over resources.” As with the effects of climate change, the poor are vulnerable to oil price volatility and restricted supply, as was seen with the food price rises in 2008, which the World Food Programme described as a “…a silent tsunami threatening to plunge more than 100 million people on every continent into hunger.” Such volatility has geopolitical implications that are difficult to predict but are likely to be in the form of increased tension between states, rioting and protests around the world and human rights abuses perpetrated by kleptocratic governments. A scenario of collapse within one or two decades, with the decline of globalisation and increased environmental destruction, is suggested.

Like the other reports summarised above, Global Witness describe the strong links between oil use and economic growth and the consequent reversal of growth with a declining supply of oil. With each price shock comes “a vast deployment of national wealth by consuming economies, expenditure that would have been better used in the creation of an alternative and sustainable energy system.” The Heads in the Sand report provides a useful overview of key illustrated facts and figures relating to peak oil aimed at the general reader and is international in outlook, rather than concerned specifically with industry analysis or the impact on the UK economy. It also examines the alternatives to conventional oil production and their feasibility. Enhanced Oil Recovery (EOR), exploitation of Canada’s tar sands, oil shales, heavy oil and natural gas liquids all come with caveats that make them very unlikely to mitigate a decline in global oil production this decade and often come with serious environmental impacts.

In particular, is the problem of shrinking Energy Return On Investment (EROI), which refers to the ratio of energy input required to produce each unit of energy output. The Canadian tar sands, for example, have a net energy of around 10:1 compared with conventional oil of around 30:1. Therefore, the estimated production of 5.9m barrels/day from the tar sands by 2030 is actually worth just 1.6m barrels/day of conventional oil output. Increasingly, more energy that is produced is being diverted back into the production of raw energy.

Finally, Global Witness discuss the wasted decade when governments could have acted to mitigate the effects of peak oil, but chose to rely on the overly optimistic projections, claiming that the IEA misrepresented projected discovery data and was overconfident in its forecasts of future oil production. Clearly business as usual is no longer an option and radical measures are required by governments to address the scale and imminence of peak oil and its impacts.

Climate Change: Playing our part

Since the introduction of the Climate Change Act 2008, all UK residents are legally bound to this ‘enormous task’ which is set out in the government’s Low Carbon Transition Plan. I’ve chosen three sources ((Roger A Pielke Jr, The British Climate Change Act: a critical evaluation and proposed alternative approach, June 2009; The Royal Academy of Engineering, Generating the Future. A report on UK energy systems fit for 2050, March 2010; Makiko Sato & James Hansen, What Path is the Real World Following?)) that discuss the challenge of an 80% reduction of UK greenhouse gas emissions from 1990 levels by 2050 as well as an update on current emissions trends. One paper is concerned with policy, one with technology and another looks at ‘what path the real world is following?’ based on very recent data.

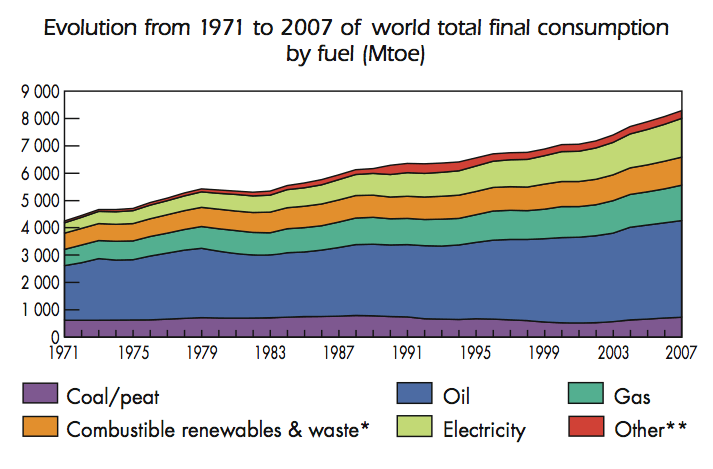
The Royal Academy of Engineering’s report, Generating the Future. A report on UK energy systems fit for 2050, warns of the magnitude of the task of reducing emissions by 80%, examining four possible energy scenarios that could meet that target. The report discusses the engineering challenges, emphasising how dependent we currently are on fossil fuels for the vast majority of our energy. A reduction in emissions of 80% would change the chart below, “beyond all recognition.” Carbon Capture and Storage (CCS) of coal, “if successful”, would allow for greater use of coal, but “major changes” would still be required.

The report makes the point that most of the technologies required are already available, but the period of transition from R&D to 90% market penetration is normally in the region of 30-40 years. Not only is the transition to the use of new technologies a major challenge, but the building of new infrastructure is also a “huge challenge.” Reference is made to how the country has met comparable challenges when “on a war footing” when a whole national manufacturing base shifts focus, but clearly the point being made is that the task is not just technological, nor economic, but political and social. Where is the policy that confronts the threat of this ‘war’?

At present there is generally insufficient incentive to make the switch to a new low-carbon technology, particularly when such a switch would be costly and disruptive.

As Engineers, the report highlights the scale of work that is required, listing examples such as the building of three miles of wave power machines each month for the next 40 years, the importing of huge numbers of wind and wave turbines, the building of port facilities to handle the scale of off-shore wind turbine construction (similar on scale to that required for the North Sea oil and gas development), a network of pipes to carry carbon captured from coal stations, again equivalent to the infrastructure developed for the North Sea Oil and gas industry. Their scenarios all necessitate a major upgrade to the electricity grid, not seen since the 1970s, requiring billions of pounds of investment, too. The electrification of transport and improvements to the efficiency of buildings, require “major systemic changes” to millions of individual assets. To build and maintain this, major training programmes are required to develop the skills needed for this to succeed. With new technologies, new academic disciplines will be needed, too. All of this will take place within an increasingly competitive global environment as other countries work towards decarbonisation and requires our industry to remain agile enough so as to avoid lock-in to new technologies that have short-term benefit but become obsolete over these crucial decades. “In summary, the changes to the UK energy system required to meet any of the scenarios will be considerable and disruptive.”

The report is largely concerned with the balance of energy and its flow and does not address issues of energy security. It shows how the Climate Change Act requires a change from this:

to this:

The first scenario sets the demand level to be the same as current levels. It should, however, be stressed that this by no means represents business as usual. Simply keeping demand at a similar level to now will require considerable effort. … In technological terms there are no choices to be made – the demand is so large that every available technology will be needed as quickly as possible. The main problems for scenario 1 will be buildability and cost to the nation. With over 80 new nuclear or CCS power plants required – around two per year – along with vast increases in all forms of renewables, building the system would require an enormous effort, probably only achievable by monopolising most of the national wealth and resources.

Rather than outlining the other three scenarios, which assume reductions and changes in demand through efficiencies and alternative uses of technology as well as a substantial use of low-grade heat, it is worth noting the statement above that keeping demand as it is, is a challenge in itself. Since 1980, with the exception of industry, ((Energy demand from industry has decreased -34% presumably due to the de-industrialisation of our economy)) the UK’s final energy demand has risen +68% for transport, +10% for the domestic sector and +3% for the service sector. ((DECC, UK Energy in Brief 2008)) There is a limit to how much more we can de-industrialise so the kinds of demand reductions required for scenarios 2, 3 & 4, assume reductions in sectors that have  never previously shown reductions. All scenarios suffer from increased reliance on intermittent sources of energy supply and it is suggested that until we have “adjusted” to this new system, fossil fuels are used as backup sources until 2050. There is an assumption that new, unknown technologies will improve the resilience of supply beyond 2050.

The report concludes that while each of the four scenarios is only meant to be illustrative and not predictive, they do show there is no single ‘silver bullet’ that will achieve the cuts in emissions that are required. The report is useful in the way it discusses energy flows in a national system of supply and demand. Key to each scenario is that electricity generated from a variety of renewable and low carbon sources, will have to become the major source of power, providing energy to around 80% of our transportation. Energy demand must be reduced in all scenarios, even the first scenario which assumes no further increase in demand, represents a reduction on current forecasts. The need for behavioural change is briefly mentioned, but not elaborated on.

The urgency of the task is highlighted in terms of both its scale and the time required to meet the 2050 target and because a re-engineering of the UK’s energy infrastructure is necessarily measured in decades, with technologies themselves expected to be in place for several decades, too, it is the current crop of low carbon technologies that will have to make the significant contribution to the 2050 targets. Future technologies belong to the future and will make little contribution to the work required over the next 40 years. Quite bluntly, the report states: “There is no more time left for further consultations or detailed optimisation. Equally, there is no time left to wait for new technical developments or innovation. We have to commit to new plant and supporting infrastructure now.” The report calls for strong direction from government, admitting that the scale of the challenge is

currently beyond the capacity of the energy industry to deliver. In order to achieve the scale of change needed, industry will require strong direction from government. Current market forces and fiscal incentives will not be adequate to deliver the shareholder value in the short-term and to guarantee the scale of investment necessary in this timescale.

Finally, the report is critical of the current policy situation, stating that

current government structures, including market regulation, are, as yet, simply not adequate for the task.” Government must be re-organised around the challenge (i.e. be on a ‘war footing’), in order to provide “the clear and stable long-term framework for business and the public that is not currently in evidence. It also needs to be recognised that the significant changes required to the UK energy system to meet the emissions reduction targets will inevitably, involve significant rises in energy costs to end users. ((I should also add that a similar report by the Institute of Mechanical Engineers complements the recommendations of this report, too. However, the report places a greater emphasis on the need for methods of adaptation and not just mitigation.))

Pielke Jnr.’s paper, The British Climate Change Act: a critical evaluation and proposed alternative approach, is a short and revealing paper which argues that the magnitude of the task set out by the UK Climate Change Act will inevitably lead to its failure as a piece of legislation and that the sooner this is recognised, the better chance there is of creating policy which drives realistic outcomes. The paper is not an examination of technologies, but rather a calculation of and reflection on the UK’s past rates of decarbonisation and a comparison with other countries’ demonstrable rates of decarbonisation.

Methodologically, Pielke Jnr. examines two “primary factors” that lead to emissions: economic growth (or contraction) i.e. GDP, and changes in technology, typically represented as carbon dioxide emissions per unit of GDP.

Each of these two primary factors is typically broken down into a further two sub-factors. GDP growth (or contraction) is comprised of changes in population and in per capita GDP. Carbon dioxide emissions per unit GDP is represented by the product of energy intensity, which refers to energy per unit of GDP and carbon intensity, which refers to the amount of carbon per unit of energy.

The logic of these relationships means that “carbon accumulating in the atmosphere can be reduced only by reducing (a) population, (b) per capita GDP, or (c) carbon intensity of the economy.” Pielke is concerned with the creation of policy that will achieve its intended effect and notes that population reduction and/or a reduction in per capita GDP are not realistic strategies for governments to promote policy. Therefore, a reduction in the carbon intensity of the economy (decarbonisation), is the only realistic policy choice.

The paper approaches the challenge of de-carbonisation in two ways: a ‘bottom up’ approach, which looks at the projected increase in UK population as well as projections of per capita GDP, from which an implied rate of decarbonisation can be estimated. The other, ‘top-down’ approach, examines overall GDP growth and derives the implied rates of decarbonisation needed to meet the specified target. Through a series of straightforward calculations, Pielke’s bottom-up analysis shows that

the combined effects of population and per capita economic growth imply that to meet the 2022 and 2050 emissions targets increasing energy efficiency and reduced carbon intensity of energy would have to occur at an average annual rate of 5.4%–2050 and 4.0%– 2022. These numbers also imply that successfully meeting the 2022 target with a 4.0% annual rate of decarbonization would necessitate a rate higher than 5.4% from 2022 to 2050.

The top-down analysis begins with an assumption about future economic growth, integrating future population growth and future per capita economic growth, then works backwards to determine the rate of de-carbonisation required to meet the future emissions target. This approach underlines the fact that higher rates of GDP growth likewise require higher rates of decarbonisation. It is worth reading the paper for a full understanding of the figures alone, but in summary, this analysis shows that the rates of de-carbonisation required are “4.4% per year for the 2022 target and 5.5% for the 2050 target. These numbers are substantially higher than the rates of decarbonization observed from 1980 to 2006 and 2001 to 2006.” By comparison, between 1980 and 2006, the actual rate of de-carbonisation in the UK was 1.9%, decreasing to 1.3% during the period 2001-6.

In response to this, Julia King, Vice Chancellor of Aston University and member of the Climate Change Committee, replied that technically, these rates of de-carbonisation are “do-able”. However,

I think you really do need to take due account of the fact that most people who are putting together targets and timetables are doing this on the basis of a lot of research into potential scenarios. It is another issue turning that into policy, for governments, and it is very easy for all of us who do not have to be elected to say ‘this is how I would do it’, and I have a lot of sympathy for our politicians, because they are dealing with extremely selfish populations.

The latter part of Pielke’s paper compares his analysis with the actual rates of decarbonisation in the UK and other countries. France provides a good example of the magnitude of the decarbonisation challenge as it is the major, developed economy with the lowest rates of emissions (0.30 t of carbon dioxide per $1000 of GDP in 2006). France has achieved this due to its reliance on nuclear power for electricity generation and was able to decarbonise overall by about 2.5% during the period 1980-2006. Notably, however, it only achieved a rate of 1.0% during 1990 to 2006.

It took France about 20 years to decarbonize from 0.42 t of carbon dioxide per $1000 GDP, the level of the UK in 2006, to 0.30 t of carbon dioxide per $1000 GDP. France’s decarbonization experience thus provides a useful analogue. For the UK to be on pace to achieve the targets for emissions reductions implied by the Climate Change Act its economy would have to become as carbon efficient as France by no later than 2016 … In practical terms this could be achieved, for example, with about 30 new nuclear plants to be built and in operation by 2015, displacing coal and gas fired electrical generation.

Pielke concludes by arguing that the approach to the Climate Change Act has been backwards, setting a target without being clear on how it will be achieved. In terms of policy success, he also points out the danger of confusing a reduction in emissions with decarbonisation, stating that a lowering of emissions, due to the recession for example, does little to change the role of energy technology in the economy. Without changes in energy technology, emissions remain tightly coupled with GDP and population growth, areas which the Climate Change Act is not attempting to reduce. The success of this policy will be on reducing emissions under the forecast conditions of economic and population growth. Thus, carbon dioxide emissions per unit of GDP (i.e. decarbonisation) is the key measurement by which to judge the policy. The UK has achieved significant rates of decarbonisation in the past (better than other countries but not as high as the Act implies), but, as pointed out above, this was due to the de-industrialisation of the 1980s and 1990s, and this rate has since slowed considerably.

Given the magnitude of the challenge and the pace of action, it would not be too strong a conclusion to suggest that the Climate Change Act has failed even before it has gotten started. The Climate Change Act does have a provision for the relevant minister to amend the targets and timetable, but only for certain conditions. Failure to meet the targets is not among those conditions. It seems likely that the Climate Change Act will have to be revisited by Parliament or simply ignored by policy makers. Achievement of its targets does not appear to be a realistic option… Because no one knows how fast a large economy can decarbonize, any policy (or policies) focused on decarbonization will have to proceed incrementally, with constant adjustment based on the proven ability to accelerate decarbonization (cf Anderson et al 2008). Setting targets and timetables for emissions reductions absent knowledge of the ability to decarbonize is thus just political fiction.

Finally, Pielke proposes alternative methods of accelerating decarbonisation. These would involve international co-operation in assisting other countries to decarbonise to at least the level currently observed in the UK and focussing on sector specific policy that addressed the processes of decarbonisation but without the impossible targets and timetables, the expansion of low/no carbon energy supplies and incremental improvements rather than long-term measures. It is a useful paper, both for its analysis and its approach, one which clearly recognises that economic growth will remain the first priority for the UK and other countries.

The last recent source on Climate Change research I’d like to reflect on is Makiko Sato & James Hansen’s, What Path is the Real World Following? This is a website which provides updates to NASA scientist Hansen’s book, Storms of My Grandchildren.

Created 2010/05/11

What the graph above shows is that current global emissions are worse than any of the ‘marker scenarios’ outlined in the 2007 IPCC assessment report on Climate Change. Rather than repeat it here, Stuart Staniford provides an excellent analysis of what this implies. To add to this, I would simply suggest that by the time of the next IPCC report in 2014, it seems likely to me that if the Peak Oil and Climate Change summaries I’ve given above are on the money, the strategy, policy and methods of public engagement to address the related predicaments of both energy and climate change will require a significant re-think in the middle of this decade, just before the next UK general election.

Some significant questions remain, too:

If economic growth is coupled to the supply of energy, how will Peak Oil affect global GDP? The Climate Change Act, Peilke’s analysis and the IPCC scenarios, assume continued economic growth yet how will a decline in the production of oil (and by implication a decline in GDP) affect both the production and supply of other fossil fuels and our ability to fund the required transition to low-carbon economies? Will we have to wait until the subsequent (post 2014) IPCC report before they take Peak Oil and its economic consequences into account? I guess so.

Revisiting ‘Thinking the unthinkable’

In October, I wrote a post which gave an overview of a (failed) bid to JISC.

“What will happen to the provision of a technology dependent education when energy consumption is restricted by recurring interruptions in supply and significant spikes in costs?” This project aims to address this question by re-framing ‘Sustainable ICT’ within the context of an imminent crisis in energy supply. As we increasingly turn to ICT to enhance, support and deliver education and research, the prospect of an energy crisis within the next ten years becomes crucially important to our sector, its partners and stakeholders. The project will use JISC’s Scenario Planning tools to address this crisis and examine the wider energy context, which fuels the UK’s industrialised and globalising model of Higher Education.

I have added the feedback I received as a postscript to the original post. Needless to say I was disappointed that it did not receive funding at that time, but very encouraged by the positive response I received from the evaluation panel.

Since submitting the bid, I have continued to pursue this area of research and wanted to reflect on the last four months of intensively reading around the subject of energy, climate change and, to a lesser extent, the resilience of HEIs. I have written about some of this in other posts, but think that a summary update would be useful for me to gather my thinking and perhaps be of interest to you, too. I should say upfront, that today, as I write, I’m not especially optimistic about the ability for the tertiary education sector to continue in its current form beyond the end of this decade (mainly due to increasing economic pressures) and hope that I offer enough reasons below to motivate other people to join Richard Hall and I, in pursuing this research further.

Peak Oil (or an oil ‘supply crunch’)

As I was writing the original research bid, The UK Energy Research Centre published their Global Oil Depletion Report, a massive survey of recent literature on the subject of Peak Oil. They concluded:

On the basis of current evidence we suggest that a peak of conventional oil production before 2030 appears likely and there is a significant risk of a peak before 2020.

As I’ve noted before, there is reason to suggest that oil production has already peaked, since supply has effectively plateaued  since 2005, despite the annual price of oil steadily increasing in the midst of significant price volatility.

Since the UKERC report, there have been other notable reports which forecast a peak in oil production by 2020. For example, yesterday the Peak Oil Task Force, a group of six UK companies, including Virgin, Scottish and Southern Energy and Stagecoach, published a report which warns of the “urgent, clear and present danger” of an ‘oil crunch’ by 2015:

The next five years will see us face another crunch – the oil crunch. This time, we do have the chance to prepare. The challenge is to use that time well. As we reach maximum oil extraction rates, the era of cheap oil is behind us. We must plan for a world in which oil prices are likely to be both higher and more volatile and where oil price shocks have the potential to destabilise economic, political and social activity. Virtually every sector of our economy is still dependent on oil.

This follows several other recent reports and warnings. For example, a Chatham House report forecasts a 2013 peak, the NGO, Global Witness, warns of an imminent supply crunch; Petrobras, Brazil’s oil company, a 2012 oil crunch; the CEO of Total SA, forecasts a peak by 2015Shell’s CEO likewise forecasts an end to easily accessible oil by 2015Chevron are vague on the date (2012?), but issued [PDF] a clear warning in 2005; the former VC of  Saudi Aramco, the world’s largest producer of oil, has said that oil production has peaked and is currently on a plateau. The International Energy Agency (IEA), representing OECD countries, has warned of an oil crunch from 2011, with production peaking by the end of the decade.

The conventional economic theory of demand destruction caused by the rising price of oil has had very little effect on the amount of oil consumed and conversely, price rises and therefore opportunity for investment over the long-term and incentives to produce more to sell in the short-term, have not resulted in a rise in oil production. Between 2002-5, “for every dollar increase in oil prices, three year cumulative global crude oil production increased at 167 mb per dollar.” However, between 2006-8… “for every dollar increase in oil prices, three year cumulative global crude oil production fell at 15 mb per dollar, again relative to the 2005 rate.” ((Comment on Oil Drum)) Similarly, the ex-VC of Saudi Aramco has said:

The evidence is that in spite of the increases – very large increases – in oil prices over the last four years, we haven’t been able to match that with increasing capacity. So, essentially, we are on a plateau.

Energy Security

In the original bid to JISC, I framed the problems of Peak Oil and Climate Change as potentially serious impacts on the operation of HEIs and therefore the provision of tertiary education in the UK. Energy security is a broad term that covers the supply and distribution of the different fuels that we need to fuel a growing economy. Global economic growth (GDP) is closely coupled to the global consumption of oil, and while there are indications that the demand for oil by OECD countries has started to decline, global demand is still expected to rise because of the demand by developing countries.

So we have a situation where the global demand for oil will outstrip the available supply of oil, therefore impacting on economic growth. On today’s Financial Times ‘Energy Source‘ blog, Geologist, Colin Campbell was quoted from 2006, saying:

I think we are facing an oil price shock, 100 or 200 dollars a barrel, an economic recession that cuts demand, and I will not be at all surprised if a fall in demand would make the price collapse again. So we might be back to 20 or 30 dollars a barrel next year perhaps. And so you have a price shock, a recession, a recovery, hits again the falling capacity limit, another price shock. And so I think that in the next few years, we have a sequence of vicious circles and gradually the reality of the situation will filtered through. We are on for a very volatile few years with enormous economic consequences.

The FT reporter thinks this view is “on the money” and I am inclined to agree, too.

Peak Oil is not the only energy security problem that we face over the next decade. The year 2016 is commonly given as the point where our national infrastructure, in it’s current form, can no longer supply the energy we demand.

Planned closures of ageing nuclear plant and the removal, by the end of 2015, of a significant amount of coal and oil-fired power stations under European environmental legislation is likely to lead to a large fall in the electricity capacity margin. ((Project Discovery – Energy Market Scenarios, p.5))

Ofgem’s recent Project Discovery project produced four market scenarios for the UK’s energy future. Their worse case scenario, as I’ve touched on before, is a ‘dash for energy’ scenario ((Project Discovery – Energy Market Scenarios, p.16)), where “the recession proves short-lived. Demand bounces back strongly and then increases over time, although investment levels take some time to become re-established following the hiatus caused by the credit crisis.” The costs of this to consumers would be a 60% increase in energy bills by 2020. ((I’ve noted elsewhere that Ernst & Young have calculated a possible 400% increase in consumer energy bills by 2020.))

However, in December, after consultations with energy companies and academics, the Chief Executive of Ofgem thought that this was “too optimistic”. Conversely, earlier this month, Ofgem issued a warning that bills could rise by 20% over the next decade, presumably because they do not now expect a ‘dash for energy’ scenario, but rather an economic outlook of slow growth.

Ofgem conclude that we have a narrow window until 2013 to implement policy to address supply security from 2016:

Although our scenarios do not indicate concerns over supply security until beyond the middle of the current decade, the timescales required to secure finance, mobilise supply chains and deliver the infrastructure needed suggests that the period around 2012 and 2013 could be important for investment decisions critical to future secure and sustainable energy supplies. Hence, there is a window of opportunity between now and then to implement any policy measures that may be necessary to make sure that investment takes place in a timely fashion. ((Project Discovery – Options for delivering secure and sustainable energy supplies, p.5))

Whichever way I am able to understand it, the picture of energy security for the UK over the next decade looks uncertain and any response, costly. Dieter Helm, Prof. of Energy Policy at Oxford, thinks we’re in a mess and calls for “a more imaginative approach to infrastructure… The Victorians did it: the current generation needs to repeat it.” ((The Challenge of Infrastructure Investment in Britain, p.39))

The rebound effect of (technological) efficiencies

One of the measures to improve the security of our energy supply is to improve our efficiency of energy use. This effectively allows us to do the same (or more), with less energy than before. The subject of energy efficiency is also closely related to our carbon reduction targets. The 2008 EU directive on Climate Change sees energy efficiencies as “one of the key ways in which CO2 emission savings can be realised.” (p. 8) The target is a reduction of 20% by 2020.

However, there is a problem when claiming absolute targets for energy efficiency, which has been studied by the UK Energy Research Centre in a 2007 review of over 500 studies in this area. The report is called, An Assessment of the evidence for economy-wide energy savings from improved energy efficiency, otherwise known as The Rebound Effect Report.

As the report notes, there have been claims in the past that technological efficiencies result in absolute and predictable decreases in energy use, just as there have been claims that such efficiencies result in more energy being used (in the latter case, this is referred to as ‘backfire’). The basic point is that while technological efficiencies in the use of energy are real, the overall result is that only part of the actual efficiency is realised in society. This is because while we save energy through efficiencies, we spend part of those savings on other activities that use up energy.

An example of a rebound effect would be the driver who replaces a car with a fuel-efficient model, only to take advantage of its cheaper running costs to drive further and more often. Or a family that insulates their loft and puts the money saved on their heating bill towards an overseas holiday.

This was first identified as the Jevons Paradox, which I have written about before. The usefulness of the UKERC report is that it demonstrates the complexity of the issue, but also that it usefully summarises the individual and social consequences of efficiencies. Efficiencies can be divided into those that have a direct rebound effect and those that have an indirect, or economy-wide, rebound effect.

An example of a direct rebound effect quoted above is where a family drive more because they’ve bought a more fuel efficient car. The report concludes that in particular circumstances up to 30% of the intended energy ‘saved’ through efficiency might be ‘spent’ in this way, particularly in areas such as transport and heating/cooling.

An example of an indirect rebound effect quoted above is where a family insulates their loft and then uses the savings in heating costs towards a holiday. The report is hesitant to draw conclusions in this area, but indicates that up to 50% (perhaps more) of the intended energy ‘saved’ in particular circumstances through efficiency might be ‘spent’ in this way. Some studies suggest much higher numbers which, they say, should be taken with caution.

The UKERC conclude that the alarming claims of ‘backfire’, where energy efficiency measures result in an overall increase in energy used, cannot be verified but should still be taken seriously. There is more evidence of this occurring when technologies are pervasive (i.e. the steam engine or electric motor).

The conclusions of the report are now of great interest to me and have confirmed the direction my research was beginning to go: that is, the relationship between energy and economic growth. I mentioned this in my original ‘Thinking the unthinkable’ post, in terms of how economic growth, the use of energy and the production of emissions are all coupled. The UKERC report puts it like this:

In developed countries, energy use as conventionally measured has grown more slowly than the economy as a whole. From this, it is generally concluded that technical change has improved the efficiency with which energy is used and thereby helped to ‘decouple’ energy consumption from economic growth. However once different energy sources are weighted by their relative ‘quality’ or economic productivity, the coupling between energy consumption and economic growth appears far stronger. Taken together, the evidence reviewed in this report suggests that: a) the scope for substituting other inputs for energy is relatively limited; b) much technical change has historically increased energy intensity; c) energy may play a more important role in economic growth than is conventionally assumed; and d) economy-wide rebound effects may be larger than is conventionally assumed.

Claims of a decoupling of energy consumption and emissions from economic growth virtually always refer to a relative decoupling, rather than an absolute decoupling.

It’s vital to distinguish between ‘relative’ and ‘absolute’ decoupling. Relative decoupling refers to a situation where resource impacts decline relative to the GDP. Impacts may still rise, but they do so more slowly than the GDP. The situation in which resource impacts decline in absolute terms is called ‘absolute decoupling’. Needless to say, this latter situation is essential if economic activity is to remain within ecological limits.

Evidence for declining resource intensities (relative decoupling) is relatively easy to identify. The energy required to produce a unit of economic output declined by a third in the last thirty years, for instance. Global carbon intensity fell from around one kilo per dollar of economic activity to just under 770 grams per dollar.

Evidence for overall reductions in resource throughput (absolute decoupling) is much harder to find. The improvements in energy (and carbon) intensity noted above were offset by increases in the scale of economic activity over the same period. Global carbon emissions from energy use have increased by 40% since only 1990 (the Kyoto base year). ((Prosperity without growth? The transition to a sustainable economy, p. 8))

Despite efficiencies, energy use goes up

Despite efficiencies, energy use per capita goes up

Despite efficiencies, emissions go up

Meeting our carbon targets

While the ‘rebound effect’ may have some implications for our energy security in terms of how efficiency measures may or may not safeguard against a scenario of oil depletion and overall supply disruptions,  there are very clear implications for our carbon reduction targets. One of the issues, perhaps the biggest issue, is that of population increases, a subject that is often recognised in reports, but skirted over because of the seemingly hopeless task and political sensitivity of addressing it. Nevertheless, it needs to be recognised that population increases do contribute to overall energy use and emissions and need to be accounted for in calculations that inform Climate Change policy.

Richard Hall has recently begin to address this, referring to Ehrlich-Holdren’s sustainability equation

I = P.A.T

That is, the impact of human activities (I) is determined by the overall population (P), the level of affluence (A) and the level of technology (T). Quoting Tim Jackson, Richard writes:

However, a key problem is the dynamic of efficiency vs scale. Jackson notes (p. 3) that “Technology is an efficiency factor in the equation. Population and affluence are scaling factors. Even as the efficiency of technology improves, affluence and population scale up the impacts. And the overall result depends on improving technological efficiency fast enough to outrun the scale effects of affluence and population.” So these factors are not independent and “appear to be in a self-reinforcing positive feedback between affluence and technology, potentially – and I emphasise potentially – geared in the direction of rising impact”

A recent paper I have found helpful in terms of thinking about the UK’s Climate Change Act (2008) concludes that the Act is certain to fail, showing how the target of an 80% reduction in emissions by 2050 (and 34% by 2022) has no historical precedent. What I found useful, regardless of whether the targets are practicably achievable, are the author’s observations on population growth and economic growth (GDP).

In summary, Pielke shows that the UK’s population is predicted to grow by 0.7% per year to 2031, which would mean that the population will be around 67 million people. Extending this to 2050, we would have a population of about 82 million. He warns the reader that population growth forecasts are “notoriously uncertain, so caution should be used when using them, as actual future populations could be higher or lower.” (p. 2) He then considers economic activity and observes that the UK economy averaged 2.5% GDP growth (inflation adjusted) between 1990-2007. Combining the 0.7% population increase with a more modest 2% GDP growth rate, implies a per capita growth rate of 1.3% per year. Finally, Pielke factors in technological change and notes that according to the US Energy Information Agency, “from 2000 to 2006 UK energy efficiency increased by about 2% per year, while the carbon intensity of the energy supply was largely unchanged.” (p. 2)

Because the effects of technological change (including changes in the economy toward services and away from energy intensive industry) just about balanced the overall growth of the economy for the past decade, the UK has seen little growth in its overall carbon dioxide emissions (although the UK National Audit Office recently observed that the lack of growth in emissions is also due to accounting, as some economic activities, like air travel, are not included in official emissions numbers.

Following Dieter Helm, I’ve noted before that this method of accounting creates an illusion ((UK’s official CO2 figures an illusion – study. Source: Too Good to be True? The UK’s Climate Change Record [PDF])) around our official emissions figures, transforming a reported 15% reduction into a 19% increase in emissions since 1990.

It seems to me that Pielke’s observations complement Tim Jackon’s reference to the I = P.A.T equation as well as the conclusions of the UKERC’s Rebound Effect report. That is, technological efficiency, although vitally important, does not, as we might expect, lead to an overall reduction in emissions or energy consumption. It merely helps balance the impacts of population growth and consumption led economic growth. Of course, if we also take into account our emissions and energy use that we outsource to industrialising countries such as China, the balance is lost in favour of rising energy use and emissions.

What is clear to me is that technology is being used as an excuse to avoid the greater issues of a broken and destructive (suicidal?) political economy and the consequences of an aspirational and growing population. Tim Jackson puts this nicely:

The IPAT equation appears to offer us broadly three ways of achieving overall reductions in energy demand (for example). One, reduce the population – not a popular choice. Two, reduce the level of affluence (again not high on political priorities – although an interesting avenue to explore at various levels as I shall suggest in a minute). And three, improve technology: specifically to increase the energy efficiency of income generation, to reduce the energy intensity of the economy.

Given the unpopularity and political intractability of routes one and two, it’s perhaps not surprising to find the mainstream response is to adopt route three as the preferred approach. Indeed an examination of the history of international policy from Brundtland onwards reveals quite clearly how route 3 allowed the world to steer an uneasy path between the demands of the North for population control in the South and the demands of the South for reduced affluence in the North. Option 3 emerges as an apparently politically neutral way through a tricky impasse. ((Rebound launch: keynote presentation))

Our technological subservience to economic growth

Technology emerges as an apparently politically neutral way through a tricky impasse.

This single line encapsulates a great deal of what I have been trying to understand through writing these posts over the last few months and it links to a question Richard raises in his recent post:  Is this all subservient to a view of economic growth? The answer has to be yes. The production and consumption/use of technology is not politically neutral. As we have seen, all the time we pursue economic growth, technology serves the objectives of capitalism. This is evident in the long history of capitalism, just as it is evident in Higher Education today.

In short, society is faced with a profound dilemma. To resist growth is to risk economic and social collapse. To pursue it is to endanger the ecosystems on which we depend for long-term survival.

For the most part, this dilemma goes unrecognised in mainstream policy or in public debate. When reality begins to impinge on the collective consciousness, the best suggestion to hand is that we can somehow ‘decouple’ growth from its material impacts.

Never mind that decoupling isn’t happening. Never mind that no such economy has ever existed. Never mind that all our institutions and incentive structures continually point in the opposite direction. The dilemma, once recognised, looms so dangerously over our future that we are desperate to believe in miracles. Technology will save us.

Capitalism is good at technology. So let’s just keep the show on the road and hope for the best. ((Prosperity without growth? The transition to a sustainable economy, p. 102))

Despite the genuine and overwhelming challenges of energy depletion and climate change, technological development as a means to solve these problems, is merely a sideshow. Technological innovation and the resulting improvements in energy efficiency and lower emissions are vital responses, but do little more than offset the exponential problems of an increasing population and economic growth. I am hesitant to call population growth a problem all the while the relatively few rich consumers produce the majority of emissions ((George Monbiot, The Population Myth)). Economic growth and and our notion of what constitutes ‘progress’ seem to me, to warrant much of our attention when considering these issues.

I think that’s where I need to go next. Only by understanding our role within capitalism can we attempt to address the problems I’ve discussed. What better place to do this than a Higher Education institution, a place where the impacts of these issues are evident everywhere and answers to these problems can be collectively sought. I recently applied to the HEA for funding in an attempt to begin to put this into practice and will continue to think along these lines.

Energy, the economy and resilience

What impact might the increasing cost of energy have on Higher Education? My interest is not simply about the impact on institutional spending, but rather the deeper and broader socio-economic effects that an energy crisis might have on the provision of Higher Education. To the extent that Universities are businesses, I am interested in ‘business continuity’, but equally I am interested in whether the current energy intensive model of HE will remain viable and whether an energy crisis might act as a catalyst to changes in the nature of Higher Education within society.

This forms part of an on-going series of blog posts/essays, which are being collected under the tag #resilienteducation (RSS feed). My thinking on these issues is by no means complete or even coherent at times but through sketching out these ideas and hopefully receiving feedback, we can all offer useful observations on and possible solutions for the future of Higher Education. You will see that Richard Hall has recently begun to address this too, questioning the relevancy of curricula, and how building resilience to the related impacts of an energy crisis and climate change might inform learning design and pedagogy.

I appreciate that a discussion about energy fundamentals is not part of the usual discourse around educational provision, but my proposal is that it should be and will be, just as there is already a discourse around the increasing role of educational technology, which is, from one point of view, merely leveraging affordable and abundant energy for the purposes of research, teaching and learning.

In fact, the discourse around energy has already begun under the guise of Climate Change and Sustainability. When we speak of sustainability with regards to Climate Change, we are referring to a transition from a society built on fossil-fuel energy to one that is not. If adhered to, this compelling transition will be more profound than anything we have experienced in our lifetimes and is likely to last our entire professional lives, too.

As the crucial issue of Climate Change begins to dominate all aspects of society, so I expect an interest in the fundamentals of energy policy, security, production and consumption to surface in discussions about the nature of our institutional provision of education, just as an interest in carbon emissions and sustainability is surfacing now.

The facts

During the period of 2007-8, GDP in the UK hovered somewhere between 2-3%:

GDP Growth. Source: Office for National Statistics

Looking at the Consumer Price Index (CPI) between 2007-8, inflation rose from about 2% to 5%:

Inflation 2007-9. Source: Office for National Statistics

Individual earnings increased, on average, just under 4% each year during 2007-8:

Average Earnings 2007-9. Source: Office for National Statistics
Average Earnings Pay Growth 2007-9. Source: Office for National Statistics

Average household income in 2007-8 was about £30K:

Household Income 2007-8. Source: Office for National Statistics

Now, moving on to energy, consumer ‘dual fuel’ bills have more than doubled since 2004.

Dual fuel customer bill 2004-9. Source Ofgem

In 2006 (the latest figures I can find), household fuels made up, on average, 3.5% of household income. Though bear in mind that this is an average. For lower income households, it rose to 6.6%.

Household Fuel Expenditure 2006. Source: DECC (2008 report)

With the average household final income at just under £30K and the average annual household duel fuel bill at over £1200, the current percentage expenditure on household energy is more like 4%.

The scenario

In October this year, Ofgem forecast that UK domestic energy bills could rise by up to 60% over the next ten years in a scenario where the economy recovered and there is a competitive ‘dash for energy’ between countries for energy resources. Specifically, they see a difficult period around 2016 due to the closure of domestic facilities and an increased reliance on imported fuels. ((For a good overview of energy security in the EU, see the recent Briefing Paper from Chatham House: Europe’s Energy Security After Copenhagen: Time for a Retrofit?)) However, last week, at a House of Commons Select Committee, Alistair Buchanan, the chief executive of Ofgem, said that following more recent discussions with energy suppliers and academics, the 60% figure is now seen as too optimistic. He didn’t offer a revised figure from 60%, but we might consider research by Ernst & Young (commissioned by uSwitch), that warns of up to a 400% increase in the costs of domestic fuel by 2020. That is, average annual domestic energy bills could increase from £1243/year to £4733/year. ((Household fuel bills to hit almost £5K in ten years time (PDF) )) This doesn’t mean very much until we compare it to increases in average household income which, looking at the individual income, GDP and inflation charts above, we might optimistically suggest will climb back to about 3-4% each year. The forecast isn’t quite as good as that in the medium term though, with GDP predicted to grow by 1.1% in 2010, 2% in 2011, 2.3% in 2012 and 2.7% in 2013. Inflation (CPI) is likewise forecast at 1.9%, 1.6%, 2% and 2.3% each year, respectively. Anyway, let’s be a bit optimistic and say that the average final household income will rise from about £29K to around £37K in 2020 (about +2.5%/year – my Union has just agreed to a 0.5% pay increase this year). The percentage of household income spent on the £4733 energy bill would rise from 4% to nearly 13% in 2020. That’s a significant chunk of household income that for many people would force ‘efficiencies’ in energy use, result in cuts in other household spending and contribute to further fuel poverty. In terms of the Jevons Paradox, it may be understood as a method of controlling the energy consumption of the average household.

Fuel Poverty 1996-07. Source: DECC

The bigger picture

It’s useful to look at the bigger energy picture presented in my last post and consider the effect that the price of oil had on energy prices, inflation and GDP during the last few years. The prices of gas and electricity correlate closely to the price of oil:

The correlation of energy prices

Of course, not only does the price of electricity rise with oil, but the price of fuels for transportation rise, too, and when transportation costs rise, everything else, including food and consumer goods, rise. ((For 2008 average fuel prices, see The AA’s Fuel Prices 2008)) Look back to the inflation chart above and see how inflation peaked above 5% in September 2008 not long after the price of oil peaked at $147/barrel in July 2008. The effect is, unsurprisingly, that as living gets more expensive and results in sustained debts we cannot manage, we are forced to curtail consumption and GDP slows.  I mentioned in my last post that there is a belief that oil price spikes lead to recessions. ((See James Hamilton’s paper, ‘Causes and Consequences of the Oil Shock of 2007-08’. It’s worth starting from a discussion on The Oil Drum, where you can download the paper. For a more succinct summary, see the FT article here and a rebuke here. Still, even the rebuke recognises the impact oil can have on an economy: “It is through second-round effects that inflation can rise. For an oil importer, a rise in the price of oil means that the country is poorer as a whole. No matter what policy action they take, their terms of trade have deteriorated.”))

Look again at the chart below, which I used in my previous post and shows the price of oil over the last few years with a projection to 2012. The forecast of oil at around $175/barrel within the next two years, based on what we’ve just seen above, suggests the possibility of a sustained recession as economic growth is limited by the availability of affordable energy. Given the recent volatility of the oil market, we should be cautious of forecasting prices, but can, with more confidence, predict supply and demand, which prices are linked to. With oil production at a plateau, “chronic under-investment” in the oil industry (despite record income) and the additional price of carbon added to energy consumption, the retail price of energy to consumers is unlikely to go against the trend shown in this graph.  Other sources confirm the likelihood of an ‘oil crunch’ before 2015. For example, see the interview with the IEA’s Chief Economist and a report from Chatham House, which warns of a crunch by 2013 and the possibility of prices topping $200 per barrel.

World oil supply, demand and price to 2012

Finally, there is a whole other local issue of declining revenues from North Sea Oil, which was presented as a grave problem to the All Party Parliamentary Group on Oil and Gas, this week. If this post interests you, I highly recommend spending 30 minutes reading this paper which accompanied the presentation and discusses these issues in much greater depth and breadth. The paper concludes:

If we look forward, taking into account the biophysical restrictions, a major change in the nature of our economy is certain – if only because the reality of our situation dictates that it can’t stay the same. That is the political issue that British society must reconcile itself to. For the last two decades we have been living a lifestyle that has been sustained by the wealth and power created by indigenous energy resources. That cannot continue, and the process of moving from an economy that has no limits to one that must operate within more tightly constrained limits is going to be a difficult re-adjustment for many: For the political class it means redefining what it is society represents, and what its aspirations should be; for the business community it means redefining what the term “business as usual” really means; and for the public it means reassessing their own material aspirations, and perhaps a return to a far less energetic lifestyle that in terms of energy and material consumption is likely to be similar to the levels which existed in the 1950s or 1960s.

Perhaps at a later date, we might look at Higher Education in the 1950s and 60s in some detail…?

Universities are large consumers of energy

If oil and therefore energy prices are to continue to rise as both the chart above and the uSwitch research warns, what might be the cost to Higher Education? A 2008 paper estimated that UK Higher Education Institutions spent around £300m on energy in 2006, an increase of 0.5% since 2001 and representing 1.6% of total income. ((Ian Ward, Anthony Ogbonna, Hasim Altan, Sector review of UK higher education energy consumption, Energy Policy, Volume 36, Issue 8, August 2008, Pages 2939-2949, ISSN 0301-4215, DOI: 10.1016/j.enpol.2008.03.031.))

This review reveals that the energy consumption levels in UK HEIs increased by about 2.7% over the 6-year period between 2001 and 2006. The building energy-related CO2 emissions are estimated to have increased by approximately 4.3% between 2005 and 2006 alone. These trends run contrary to the national plans for emissions reductions in all sectors and are therefore a cause for action.

The Sustainable ICT project estimated that around £60m of the £300m (1/5th) was to power ICT. ((Sustainable ICT in Further and Higher Education: SusteIT Final Report, p. 97)) Since 2006, energy bills have risen by about 25% so we might expect HEIs annual electricity costs to currently be around £375m, with ICT use around £75m. The increase in the number of students in Higher Education has not resulted in a corresponding increase in energy use; closer correlations can be found between floor space and energy use and, interestingly, between research activity and energy consumption. The more research intensive universities use relatively more energy. ((Ian Ward, Anthony Ogbonna, Hasim Altan, Sector review of UK higher education energy consumption, Energy Policy, Volume 36, Issue 8, August 2008, Pages 2939-2949, ISSN 0301-4215, DOI: 10.1016/j.enpol.2008.03.031. Another interesting figure that the paper observes is that the ‘downstream’ energy use for the sector, which includes suppliers, business and student travel represents 1.5 times the direct energy consumption of the sector.)) But enough about energy prices. Annual income of HEIs increased by 10% to £23.4bn between 2007-8 and total expenditure likewise increased by 9%. ((HESA: Sources of income for UK HEIs 2006/07 and 2007/08)) How would an energy shock of +400% , increasing sector-wide energy costs from £375m to £1.5bn over the next ten years, be managed when income and spending appear to be so tightly coupled? On a more local level, my institution’s gas, electricity and oil bill is forecast to be £1.63m in 2009/10, up 6% on the last year. What would be the impact on us of an annual bill of £6.5m in 2020? (In 2007, our university had a budget surplus of £2.6m). ((University of Lincoln Financial Statements)) What areas of income are likely to accommodate an increased spend of up to 400% in ten years? Efficiencies in energy use can help, but even with planned cuts in consumption of around 5% next year, the annual cost of electricity, gas and oil at this university is still expected to rise by 0.8% under current energy prices.

Sustainability or resilience?

Resilience is the capacity of a system to absorb disturbance and reorganise while undergoing change, so as to still retain essentially the same function, structure, identity and feedbacks. ((Although it requires more elaboration and consideration in terms of educational provision, this is the common definition of ‘resilience’ used by the Transition Town movement adopted from Brian Walker and David Salt, (2006) Resilience Thinking: Sustaining Ecosystems and People in a Changing World. See Rob Hopkins (2008) The Transition Handbook. From oil dependency to local resilience. For an academic critique of the Transition Town’s use of ‘resilience’, see Alex Haxeltine and Gill Seyfang, ‘Transitions for the People: Theory and Practice of ‘Transition’ and ‘Resilience’ in the UK’s Transition Movement’. A paper presented at the 1st European Conference on Sustainability Transitions, July 2009))

What actions can HEIs take to be resilient and therefore remain relevant as dramatic social changes occur in our use of energy and therefore material consumption and output?

Resilience, it seems to me, is a pre-requisite for sustainability if you accept the tangible and coupled threats of energy security and climate change enforcing long-term zero or negative growth. If oil production has peaked just prior to the worst economic crisis in living memory and faced with the need to reduce carbon emissions by at least 80% in the next forty years, should we not first develop a more resilient model that we wish to sustain?

In terms of energy use, can efficiencies lead to sustainability? At what point does ‘efficiency’ actually mean conservation and rationing? At what point do we change our habits, our practices, our institutions instead of telling ourselves that we are being efficient, as we do today? How can we teach a relevant curricula with less money (due to funding cuts and higher costs) and less energy?

To what extent is Higher Education coupled to economic growth? Universities contribute 2.3% of UK GDP but to what extent are universities dependent on economic growth? How would a university operate under a stable but zero growth economy? To what extent is educational participation dependent on economic growth?

Sorry, lots of questions but fewer answers right now.

The Sustainable Development Commission, “the Government’s independent watchdog on sustainable development”, published a report earlier this year called Prosperity without Growth, the transition to a sustainable economy. The publication (recently developed into a book), examines what ‘prosperity’ means and discussed education alongside other ‘basic entitlements’ such as health and employment.   In particular, the author argues that these basic entitlements need not intrinsically be coupled with growth. He argues that growth itself is unsustainable and that high standards of health, education, life expectancy, etc. are not coupled with higher levels of income everywhere.

Interestingly, there is no hard and fast rule here on the relationship between income growth and improved flourishing. The poorest countries certainly suffer extraordinary deprivations in life expectancy, infant mortality and educational participation. But as incomes grow beyond about $15,000 per capita the returns to growth diminish substantially. Some countries achieve remarkable levels of flourishing with only a fraction of the income available to richer nations. [p. 43]

Participation in education vs. income per capita. Source: Prosperity without Growth

Chapter four of the publication includes a useful discussion on economic growth, technological efficiency and resilience concluding:

…the answer to the question of whether growth is functional for stability is this: in a growth-based economy, growth is functional for stability. The capitalist model has no easy route to a steady-state position. Its natural dynamics push it towards one of two states: expansion or collapse.

Put in its simplest form the ‘dilemma of growth’ can now be stated in terms of two propositions:

  • Growth is unsustainable – at least in its current form. Burgeoning resource consumption and rising environmental costs are compounding profound disparities in social wellbeing
  • ‘De-growth’ is unstable – at least under present conditions. Declining consumer demand leads to rising unemployment, falling competitiveness and a spiral of recession.

This dilemma looks at first like an impossibility theorem for a lasting prosperity. But it cannot be avoided and has to be taken seriously. The failure to do so is the single biggest threat to sustainability that we face.

Decoupling participation in Higher Education from energy use and emissions

We can see from the chart above that Cuban citizens enjoy roughly the same level of educational participation as the UK, yet their GDP per capita is just a quarter of that of the UK. Participation in this case, is “the combined primary, secondary, and tertiary gross enrolment ratio.” ((What is the Human Development Index?)) Cuba’s energy use per capita is also just a quarter of the UK’s consumption, suggesting that while GDP and energy consumption are closely coupled, GDP and educational participation need not be.

Oil demand and GDP. Source: The Oil Drum

In terms of UK HEI’s resilience, how can opportunities for participation in Higher Education remain widespread in a low energy, zero growth scenario? The Sector review of UK higher education energy consumption showed that energy consumption is not tightly coupled with student numbers, although close correlations between floor space, the number of research students and FTE staff can be seen. Does that mean that the smaller, less research intensive universities are better placed than the larger, research intensive institutions in an energy crisis scenario? Is a model of fewer universities with a higher staff-to-student ratio the answer? What other attributes, other than floor space and research activity could be used to measure resilience against the economic impact of an energy crisis?

Again, lots of questions, but fewer answers right now. Have you got any?

An energy crisis reading list

In the course of writing our GreenICT proposal, 2020 Vision: Thinking the unthinkable, I’ve read a large number of recent, good quality reports which provide ample research for the casual reader into Peak Oil and a related energy crisis. Perhaps some readers of this blog might be interested in learning more about this topic, so here are a few good places to start. If you know of other essential reports that I should include, please leave a comment.

Global Witness. Heads in the Sand (2009)

Bristol City Council. Building a Positive Future for Bristol After Peak Oil (2009)

Ofgem. Project Discovery – Energy Market Scenarios (2009)

Sustainable Development Commission. Prosperity without growth? The transition to a sustainable economy (2009)

UK Energy Research Centre. Global Oil Depletion – An assessment of the evidence for a near-term peak in global oil production (2009)

Welsh Local Government Association. Peak Oil and Energy Uncertainty (2009)

Chatham House. The Coming Oil Supply Crunch (2008)

David MacKay. Sustainable Energy – Without the hot air (2008)

The Oil Depletion Analysis Centre. Preparing for Peak Oil: Local Authorities and the Energy Crisis Report (2008)

Industry Taskforce on Peak Oil & Energy Security. The Oil Crunch: Securing the UK’s Energy Future (2008)

National Assembly for Wales. Peak Oil (2008)

International Energy Agency. World Energy Outlook – Executive Summary (2008)

Local Government Association. Volatile Times – Transport, Climate Change and the Price of Oil (2008)

Robert L. Hirsch. Peaking of World Oil Production: Impacts, Mitigation, and Risk Management (2005) + [Summary article]

Further resources (ODAC)

UPDATE: I’ve bundled these as a reading list which you can subscribe to by RSS. As I find more reports which are worth including, the reading list will be updated. You can grab the OPML file and the Atom feed, too. The source for the reading list is on delicious.