HEFCE HE Grant Allocations 2009-10 Visualised

In our weekly team meeting, I mentioned that I’d created some visualisations of the RAE research funding allocations. I also mentioned that Tony Hirst had previously done the same for the HEFCE teaching funding allocations. I offered to send everyone links to these, but before do so, I thought I’d have a go at re-creating the HEFCE visualisations myself to get a bit more practice in with IBM’s Many Eyes Wikified. So this is a companion piece to my previous post. All credit to Tony for opening my eyes to this stuff.

So, HEFCE have announced the 2009/10 grant allocations for UK Higher and Further Education institutions and provided full spreadsheets of the figures. I’ve imported the data into Google Spreadsheets and made the three tables publicly accessible as CSV files (1), (2), (3). Note that I’ve stripped out all data relating to FE grant allocations, which is included in the original spreadsheets.

Next, I’ve imported the CSV files into IBM’s Many Eyes Wikified (1), (2), (3), and these wikified tables are now the data sources for the following visualisations.

Recurrent grant for academic year 2009-10

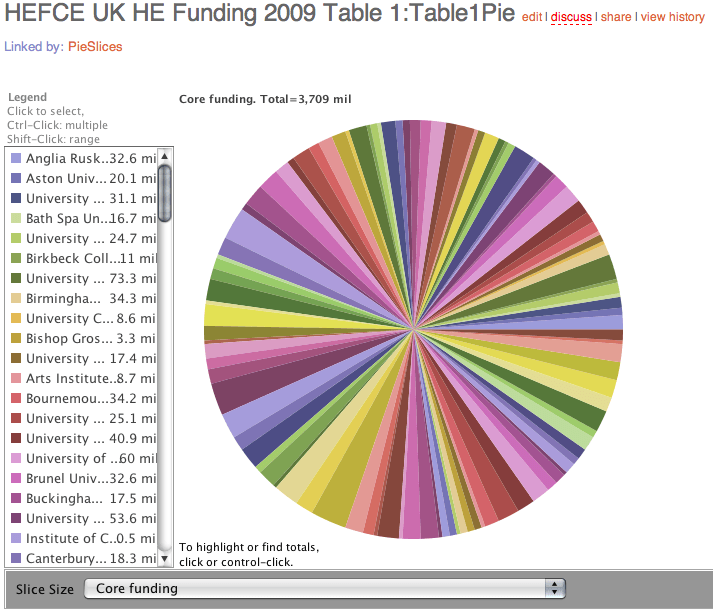
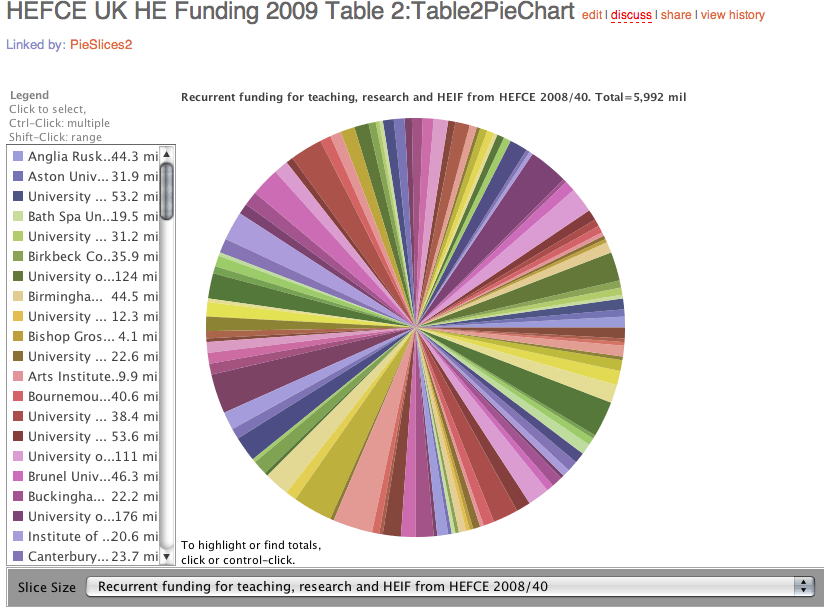
The Pie

Pie Chart of HEFCE Funding

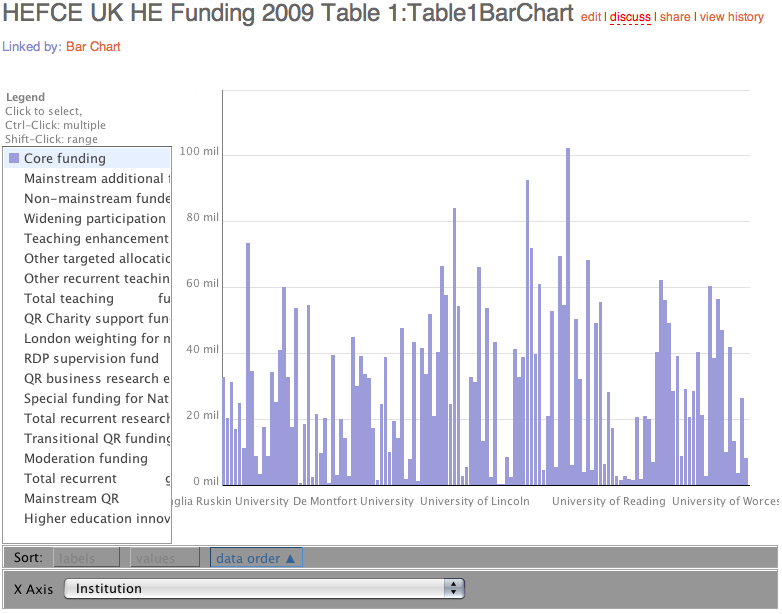
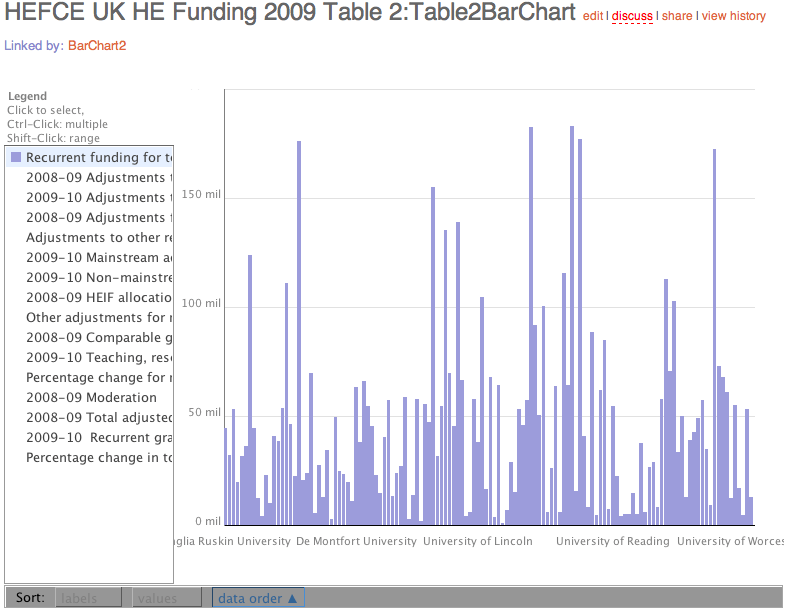
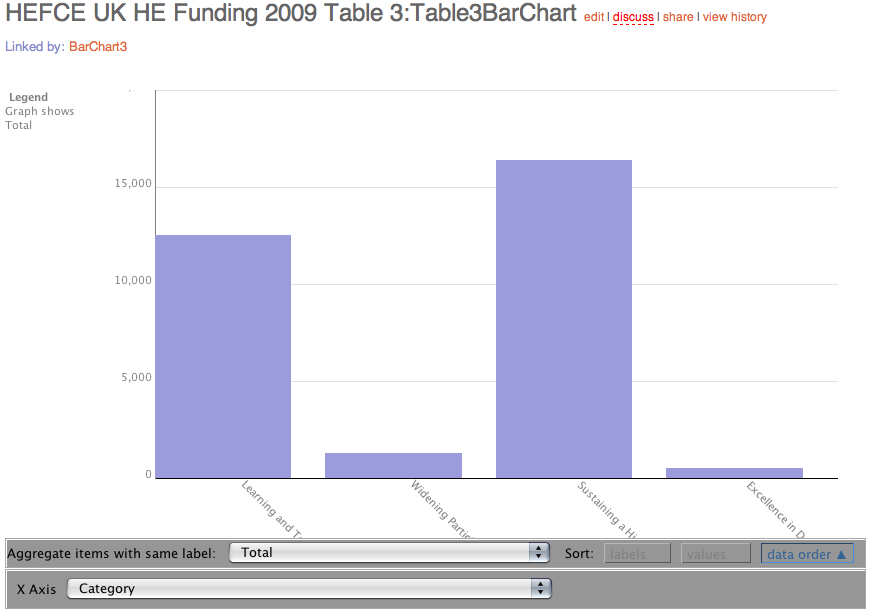
Bar Chart

HEFCE Funding Bar Chart

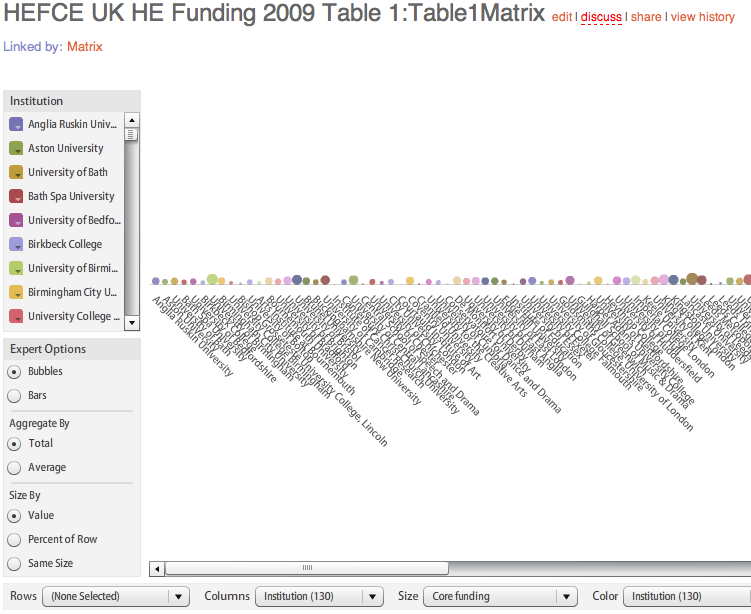
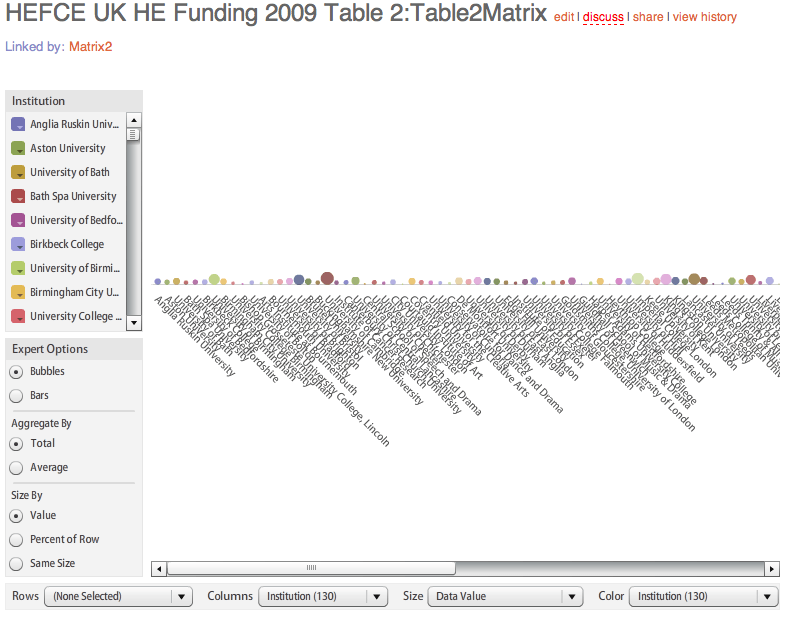
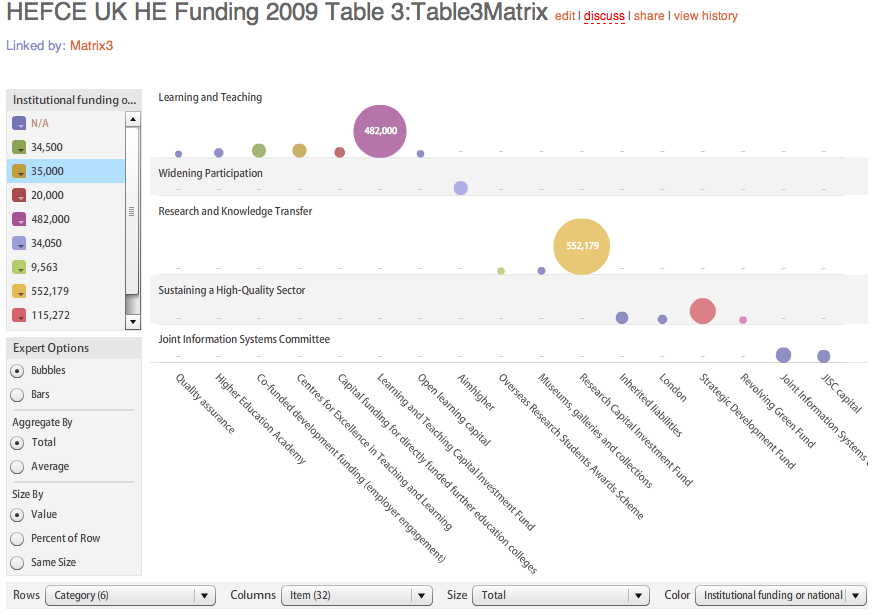
Matrix

HEFCE Funding Matrix

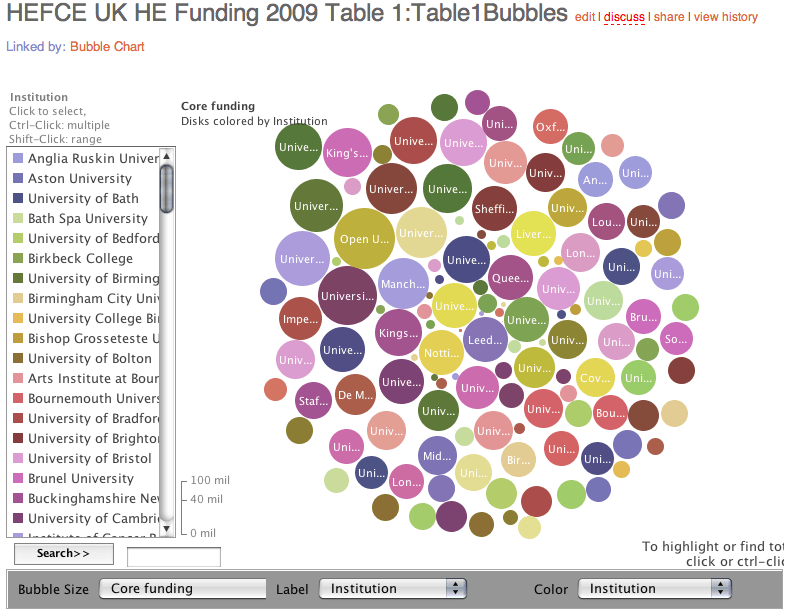
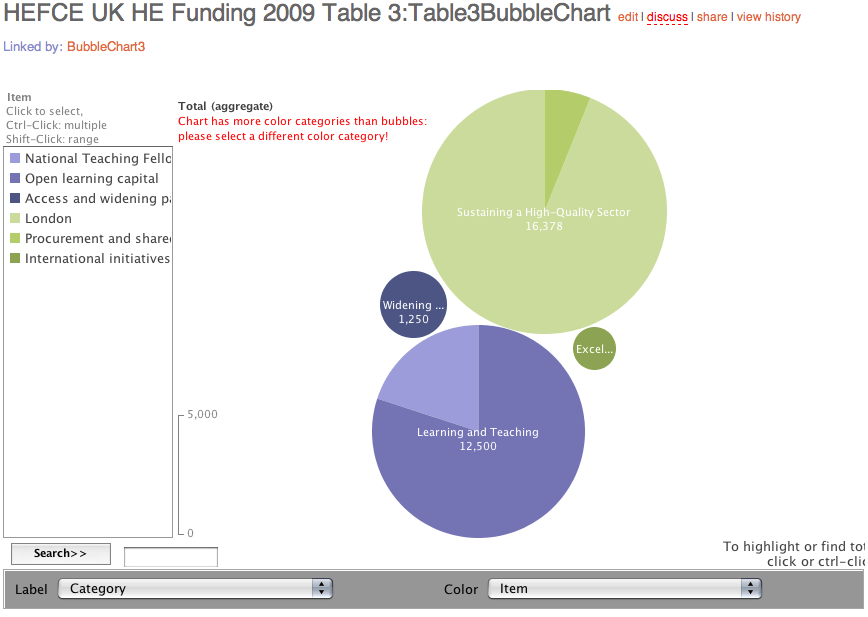
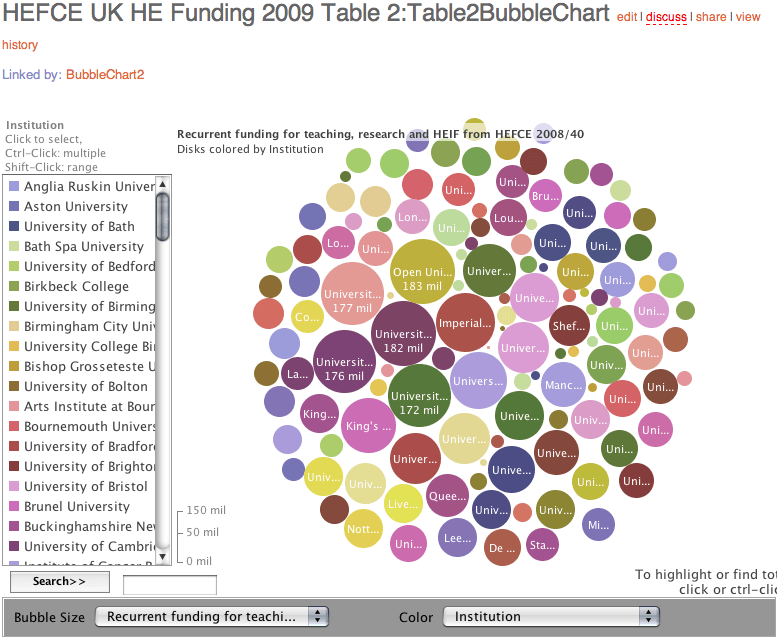
Bubble Chart

HEFCE Funding Bubble Chart

Comparison with 2008-09 academic year recurrent grant

The Pie
HEFCE Recurrent Funding Pie ChartBar Chart

HEFCE Recurrent Funding Bar ChartMatrix

HEFCE Recurrent Funding MatrixBubble

HEFCE Recurrent Funding Bubble ChartNon-recurrent funding for 2009-10

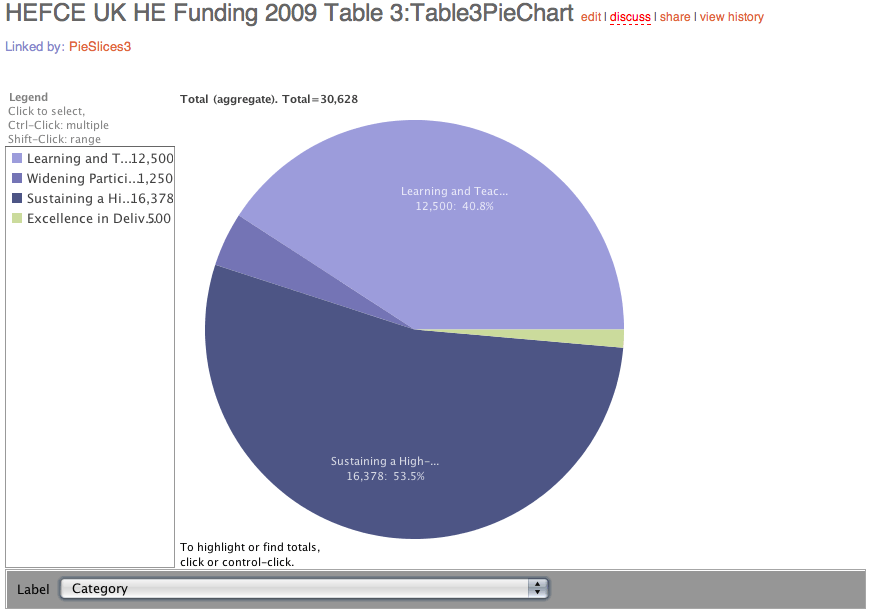
The Pie

HEFCE Non-recurrent Funding Pie Chart

Bar Chart

HEFCE Non-recurrent Funding Bar Chart

Matrix

HEFCE Non-recurrent Funding Matrix

Bubble ChartHEFCE Non-recurrent Funding

RAE: UK research funding results visualised

Yesterday, the results of the funding allocation for research in UK Higher Education were announced and published on the Times Higher Education website.

Successive RAEs have concentrated research cash in the hands of the elite. This time around, the pie has been shared more widely.

The full spreadsheet of results being available, I thought this was a good opportunity for someone to visualise the data, so I published the data on Google Docs as a CSV file, which Tony Hirst fed into IBM’s Many Eyes wiki and now we can really see how the pie has been shared. Click on the images to view the interactive visualisations.

A pie…

RAE Funding Pie
Funding allocation by university group

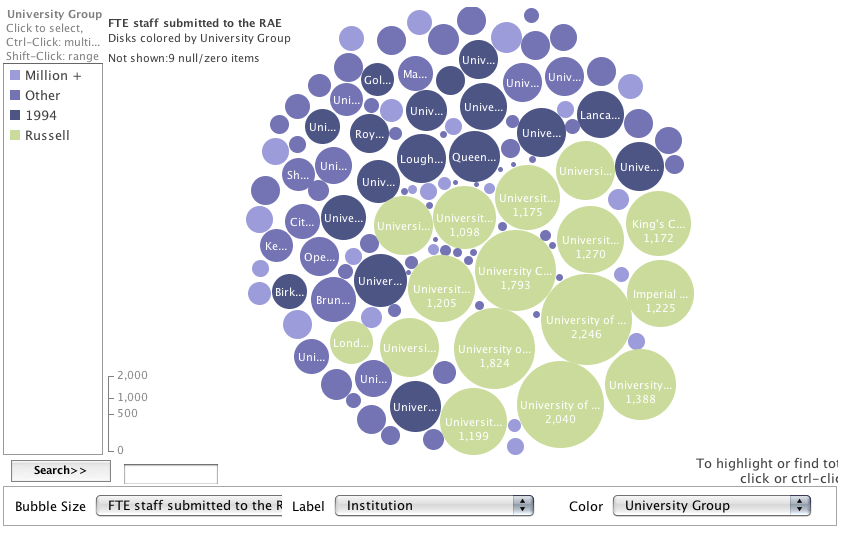
Some bubbles…

FTE staff submitted to RAE by institution and coloured by group

A bar chart…

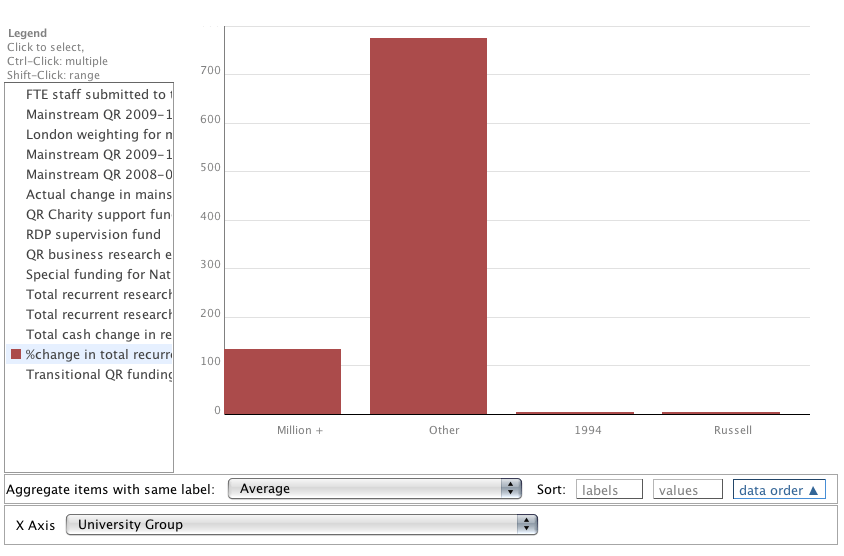
% change in total recurrent research funding
% change in total recurrent research funding by group

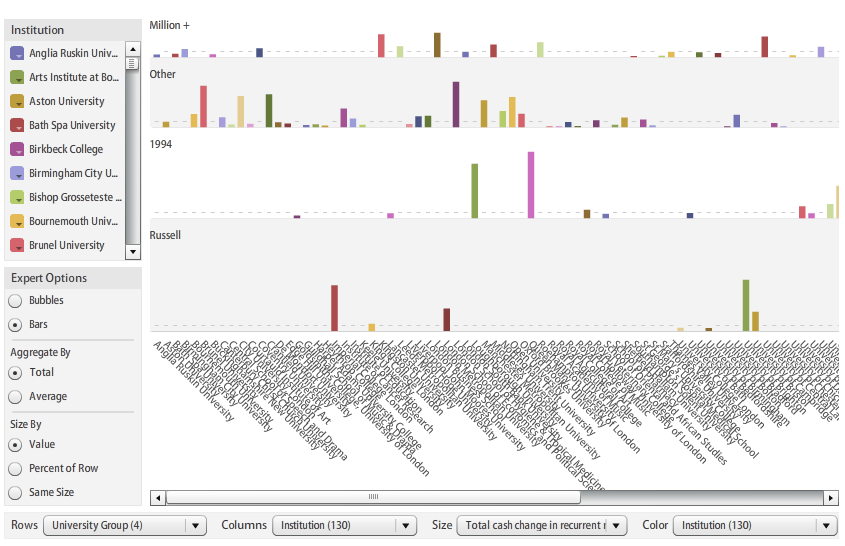
and a matrix…

Cash change in funding by institution and group

You can read about the University of Lincoln’s 628% increase in funding, here and here.

Collaboration is beautiful

While trying to sleep after posting about MOOCs, I lay thinking about massive distributed collaboration and about code_swarm, amazing visualisations of key open source software projects. Here’s a beautiful example of successful, distributed collaborative effort. Do watch for the explosion of participation in 2000 as the network effect really kicks in. As the product matures, it attracts more users and greater use attracts increased participation and a better and more popular product. All made possible by the open source license which acts as the basis for participation. There are more examples on the code_swarm site.

[vimeo 1093745]

I know, it’s not a MOOC, but there are some similarities such as mass, distributed collaboration led by one or two individuals, surrounded by a core of active participants and hundreds of occasional contributors.

Wordclouds

Take a document, count the occurrence of words, visualise the results… (click on the images, requires Java).

University of Lincoln Teaching & Learning Strategic Plan 2007-2012

University of Lincoln Strategic Plan 2007-2012

Creating a ‘wordcloud’ or ‘tagcloud’, from a Strategic Plan is one thing, but take the same technology and enter a research paper:

The Semantic Web Revisited

The English Standard Version of the Bible

Great Expectations (Dickens)

US Presidential Speeches

BBC News Archive

(do click on the links above,they’re great pieces of work)

Queen’s Speech 2007

Queen’s Speech 1997

I can see opportunities for browsing and comparing documents, visually picking out themes which emerge over time in documents like the Presidential or Queen’s Speeches. I can quickly identify the main subject areas and perhaps even discover variants in meaning to an otherwise ordinary text. This would be especially useful if combined with Apple’s Coverflow viewer, sucking in text and allowing us to browse through filesystems of documents, quickly highlighting the content of each file…

Just a matter of time.